.png)
.png)

 651
651
Ecommerce Data and Nuances
What is Inventory Delta?
Inventory Delta is the change in a store’s product count from one day to the next. By scraping publicly available dispensary menus each day, we can track product inventory levels. When we see inventory go down, we assume those units were sold — giving us a proxy for daily sales. This approach allows us to capture meaningful sales trends even without direct integration with a store’s POS system.
Example:
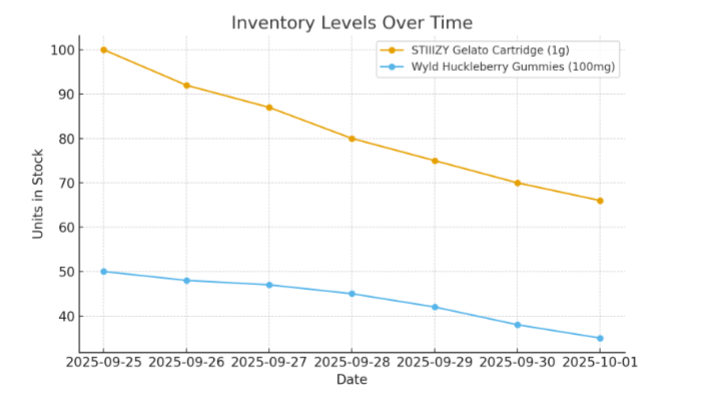
Suppose a dispensary menu shows 100 STIIIZY Gelato Cartridge (1g) units on Monday and 92 on Tuesday. The inventory delta is –8, meaning roughly 8 cartridges sold in that period. Likewise, if 50 Wyld Huckleberry Gummies (100mg) were in stock yesterday and 48 today, the delta is –2, which we interpret as approximately 2 units sold.
Example Walkthrough:
Inventory Levels Over Time
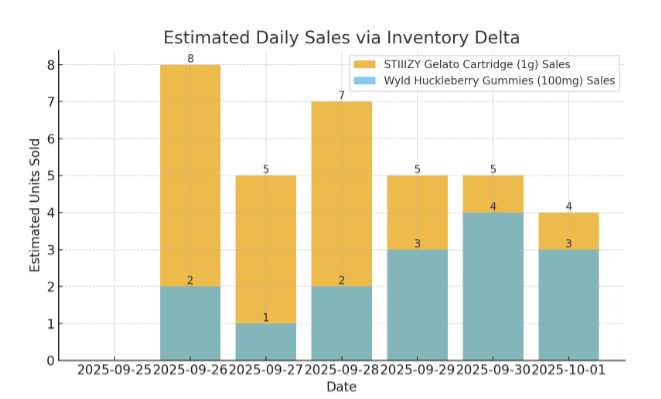
Estimated Daily Sales via Inventory Delta
Why This Matters
Unbiased View of Demand: Because we measure inventory directly from store menus, we can provide insight even without sales data feeds.
Daily Resolution: Tracking deltas day over day gives near real-time visibility into what’s moving off shelves.
Category & Brand Insights: By aggregating deltas across products, we can benchmark brand performance and uncover emerging trends.
Actionable for Operators: Retailers and brands can see which SKUs resonate with consumers and adjust marketing, promotions, and inventory accordingly.
In short: Inventory Delta = yesterday’s stock – today’s stock = estimated sales.
Gaps in the Method
While Inventory Delta is a powerful proxy, it’s important to recognize its limitations. Direct POS data remains the gold standard for accuracy. Here are some of the gaps to be aware of:
Restocks: On days when inventory goes up because a product is replenished, we ignore those changes. Only decreases are used as sales signals.
List Price vs. Actual Price: Inventory Delta sales are calculated using the list price of the product as displayed on the menu that day. This does not capture discounts, coupons, or promotions applied at the register, nor does it account for differences in tax inclusivity. By contrast, Headset Insights provides data on the actual prices consumers pay.
Menu Provider Caps: Some menu systems limit the maximum visible inventory (e.g., only showing up to 25 units). In these cases, inventory may appear “stuck” until it falls below the cap, creating blind spots in the data.
On-Shelf Only: Menu data reflects what’s currently available for sale online. It does not include back-stock inventory held in reserve. For a complete view of total store inventory, both on-shelf and inthe back, Bridge is the only way to get a full picture.
These gaps are why Inventory Delta is best used as a proxy for demand trends, while POS-direct data should be considered the most authoritative measure of sales and pricing.


