.png)
.png)

Inventory Email Dashboard

Last updated: Aug 11, 2026
419
views

Inventory Email
At the top of the report, you'll find several filters to customize your view:
- Store Location: Select a specific location to analyze. To include all stores, set the filter prefix to "is not null".
- Category: Choose a product category to narrow your results, or leave blank to include all categories.
- Vendor: Filter by a specific vendor or distributor, or leave blank for all vendors.
- Brand: Select one or more brands to analyze, or leave blank to include all brands.
- Brand Field Choice: Choose how you want the data grouped in the report:
- Brand
- Vendor/Distributor
- Product Name
- Estimated Days Remaining: Filters based on how long current inventory is expected to last, calculated using units on hand and average daily units sold, only when the product was in stock.
- Date Range: Defines the time period used for calculating sales averages and other metrics.
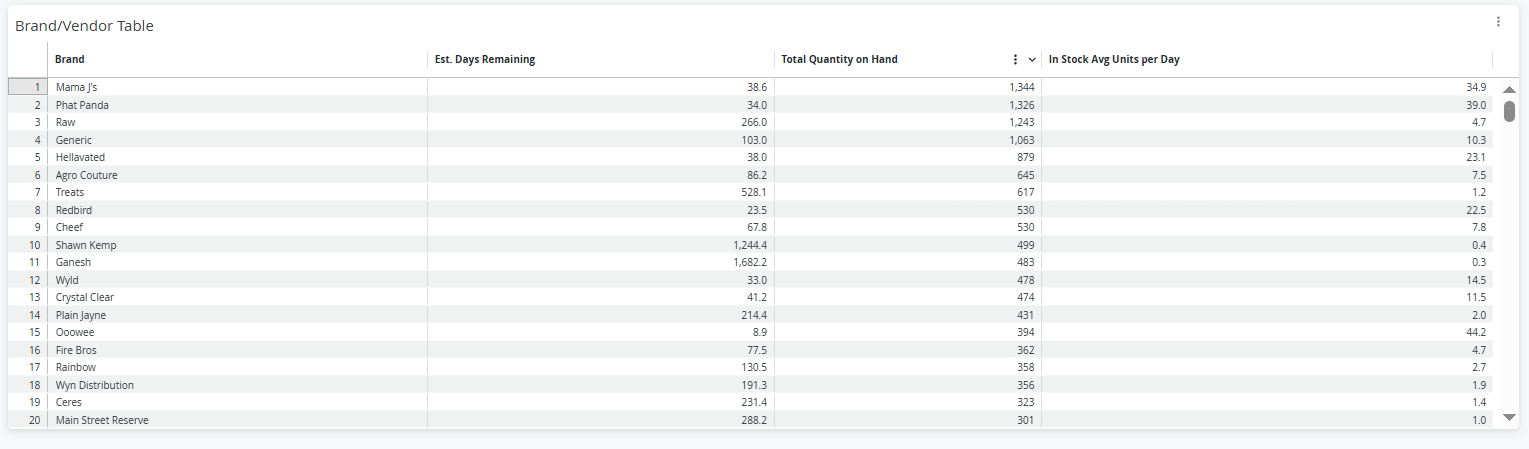
Once you've set your filters and run the report, you'll see a table with the following columns:
- Brand (or Vendor/Product Name, depending on your view)
- Estimated Days Remaining
- Total Quantity On Hand
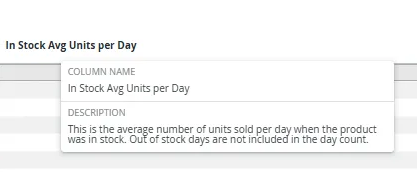
- In-Stock Average Units Per Day
**Hover over column headers to see definitions and better understand what each column represents.