.png)
.png)


Premium: Compare Baskets
The Premium Compare Baskets dashboard is designed to help you understand basket performance across your store(s), including average spend, basket distribution, and product/category penetration.
Use this dashboard to identify trends in customer purchasing behavior and compare performance across locations or product dimensions.
Average and Total Basket By Store
This provides a quick snapshot of how much customers are spending per transaction and your stores totals transaction count over the last 365 days.
If you have multiple stores you can select one by one or use the prefix “is not null” in your store filter to pull in all locations on your account.
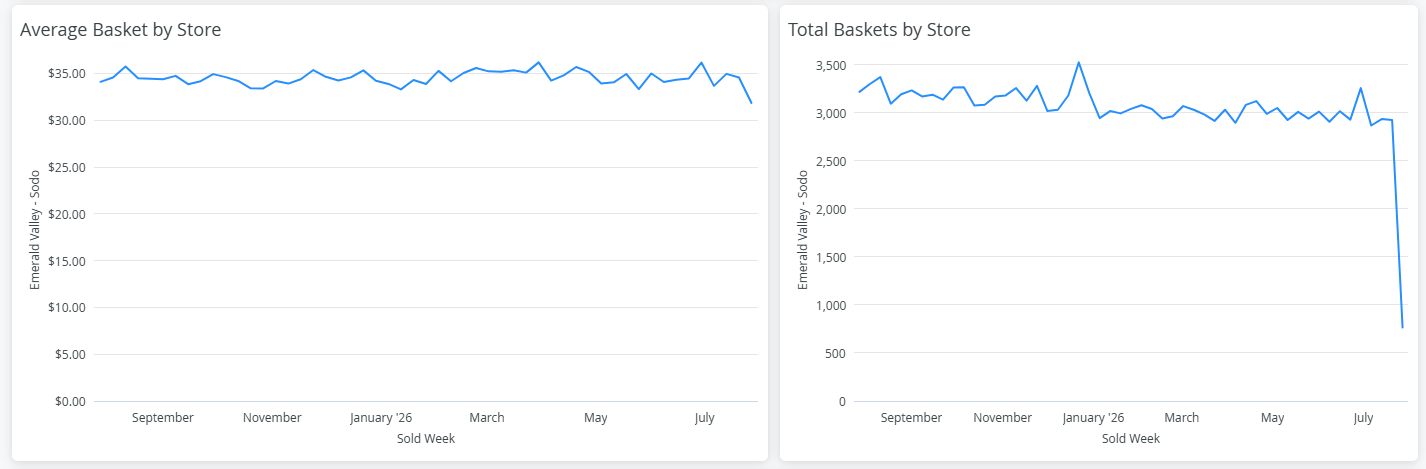
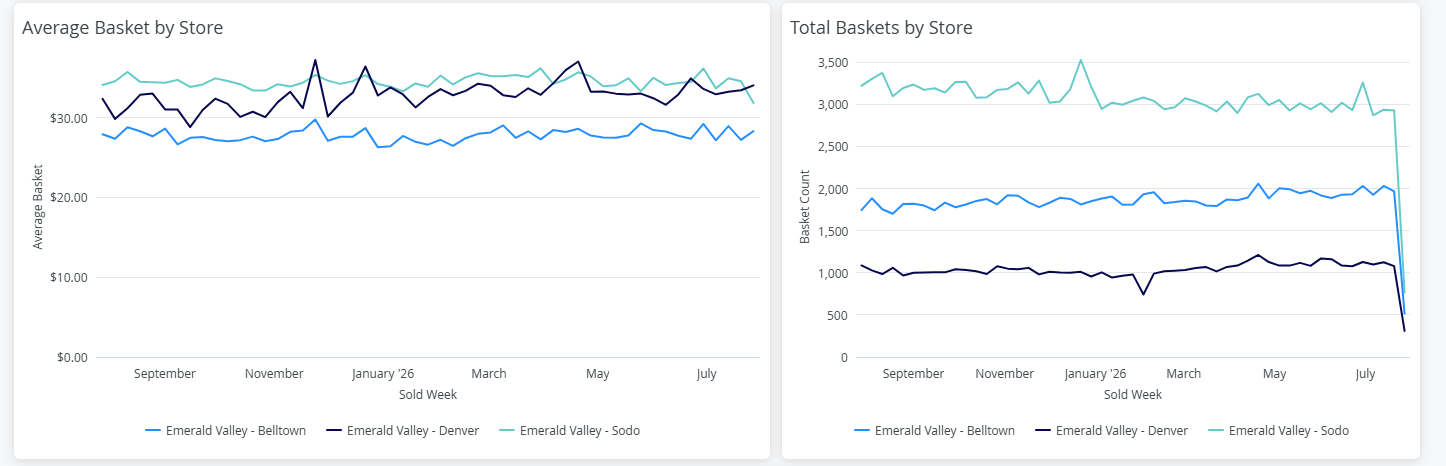
- Average Basket by Store: Compare how much customers are spending on average at each store.
- Total Baskets by Store: View total transaction volume by location to understand differences in traffic and sales activity.
These tiles are especially useful for identifying high-performing stores or locations that may need attention.
Basket Size Distribution (Last 7 Days)
This visualization shows the percentage of baskets that fall into predefined price ranges over the last seven days.
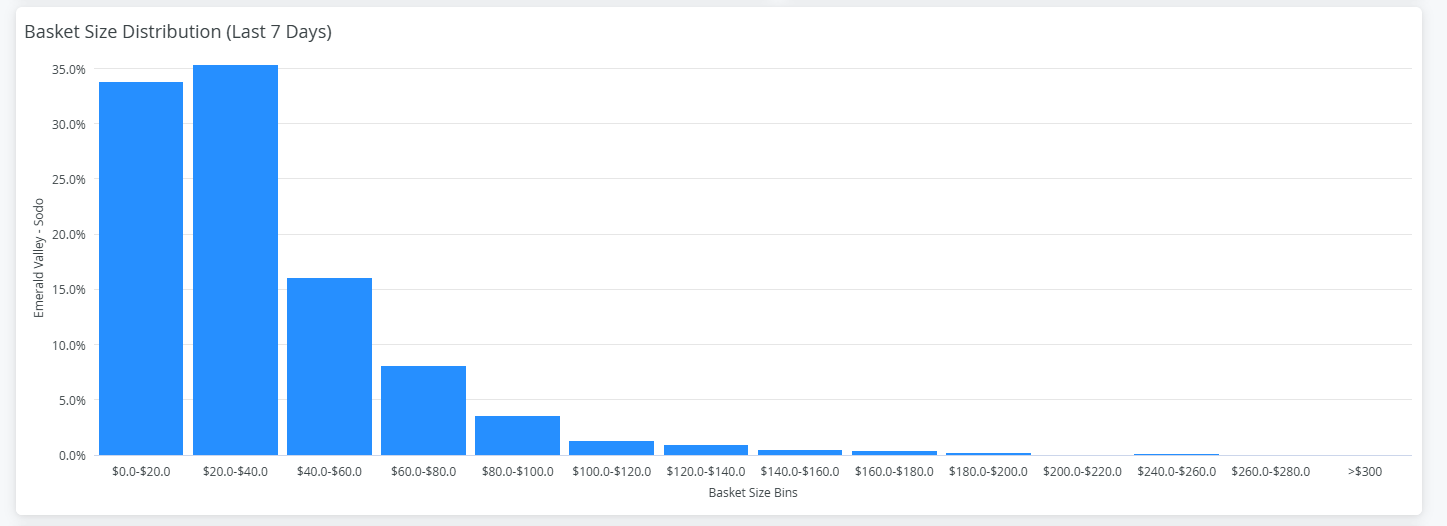
- Each “bucket” represents a basket value range (e.g., $0–$20, $20–$40, etc.)
- The chart displays the proportion of total baskets within each range
Use this section to:
- Understand typical customer spend behavior
- Identify shifts toward higher or lower-value baskets
- Spot opportunities to increase basket size through promotions or upselling
Basket Penetration by Dimension (Last 7 Days)
This section shows basket penetration based on the selected dimension, helping you understand how often certain product groupings appear in transactions.
The dimension shown here is controlled by the “Slice By” filter at the top of the page. You can choose from:
- Category
- Vendor
- Brand
- Headset Predicted Categories
When using Headset Predicted Categories, products are grouped into standardized segments:
- Flower
- Pre-Roll
- Vapor Pens
- Concentrates
- Edibles
- Tinctures & Sublingual
- Beverage
- Topical
- Capsules
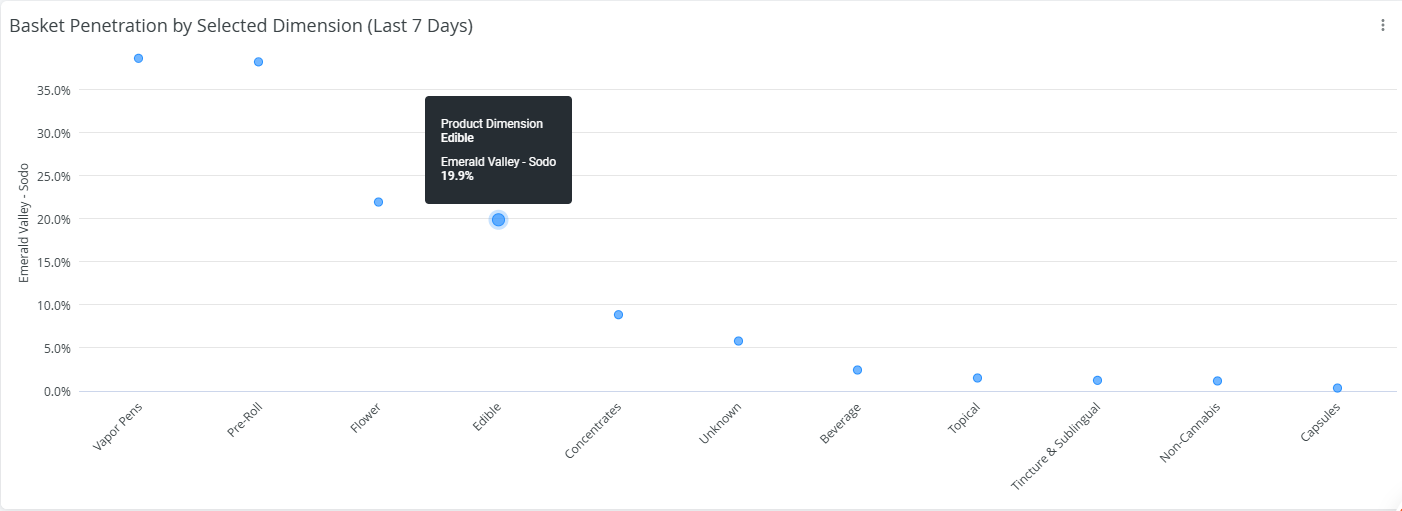
This view helps you answer questions like:
- Which product categories are most commonly included in baskets?
- Are certain brands or vendors driving more transactions.
How to Use This Dashboard
- Compare average basket size trends across stores
- Identify high-performing locations or underperforming ones
- Analyze customer spending behavior using basket distribution
- Understand product penetration to inform merchandising and promotions
- Adjust strategy based on category or brand performance within baskets
This dashboard is a powerful tool for improving both customer spend and product strategy, giving you clear visibility into how baskets are built and where opportunities exist.


