.png)
.png)


Benchmarking: Sales Growth
The Benchmarking Sales Growth Dashboard is designed to help you compare your own dispensary sales growth against the broader market. Tiles with titles such as “Your Weekly Sales and Growth” are pulling data directly from your Retailer instance, powered by your POS. The titles that start with “Insights” are based on data from our Insights tool.
At the top of the page, you’ll find a set of filters to customize your analysis:
-
Market/State (Your Market): Select the market where your store(s) operate.
-
Market/State to Compare Against: Choose a market you’d like to benchmark your sales against.
-
Date Range: Define the period for your comparison.
-
Store Selector: View results for one specific store, or leave blank to include all your connected store locations.
-
Category View:
- Your Categories: Based on how you input categories in your point-of-sale (POS) system.
- Headset Predicted Categories: Our system automatically groups any category that aligns with our 9 standard categories (Flower, Prerolls, Concentrates, Edibles, Beverages, Capsules, Vapor Pens, Topical, and Tincture/Sublingual).
** For instance, if your store has various Rosin categories like Indica, Sativa, and Hybrid, the system combines them into a single Concentrates category, simplifying comparisons with the overall market.
-
Sort Results By: Choose whether to view your results by Brand or Vendor.
Overview
The text at at the top of the page below the filters helps explain Insights data and Headset Predicted categories and includes a link to our Insights Methodology help article!

Weekly Sales Growth Comparison
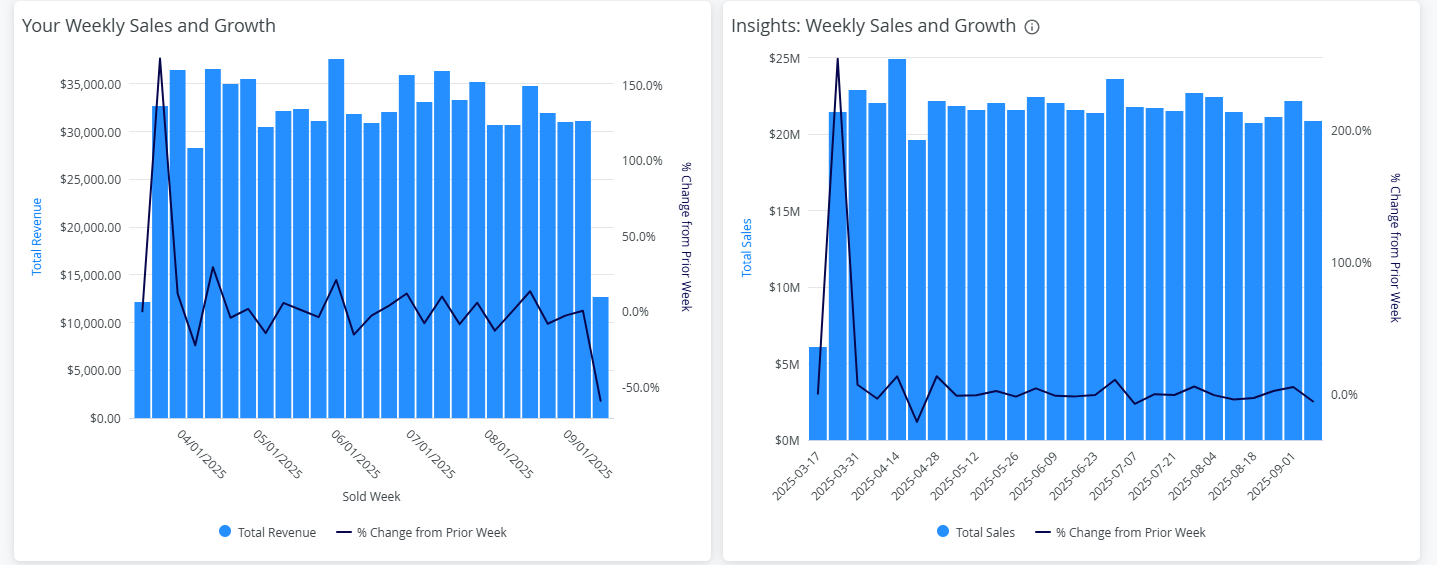
- Left (Your Data): Weekly sales and growth totals from your POS system.
- Right (Market Data): Weekly sales and growth from the selected comparison market.
- Tip: Hover over each bar to see sold week and revenue totals.
Category Sales Growth Tables
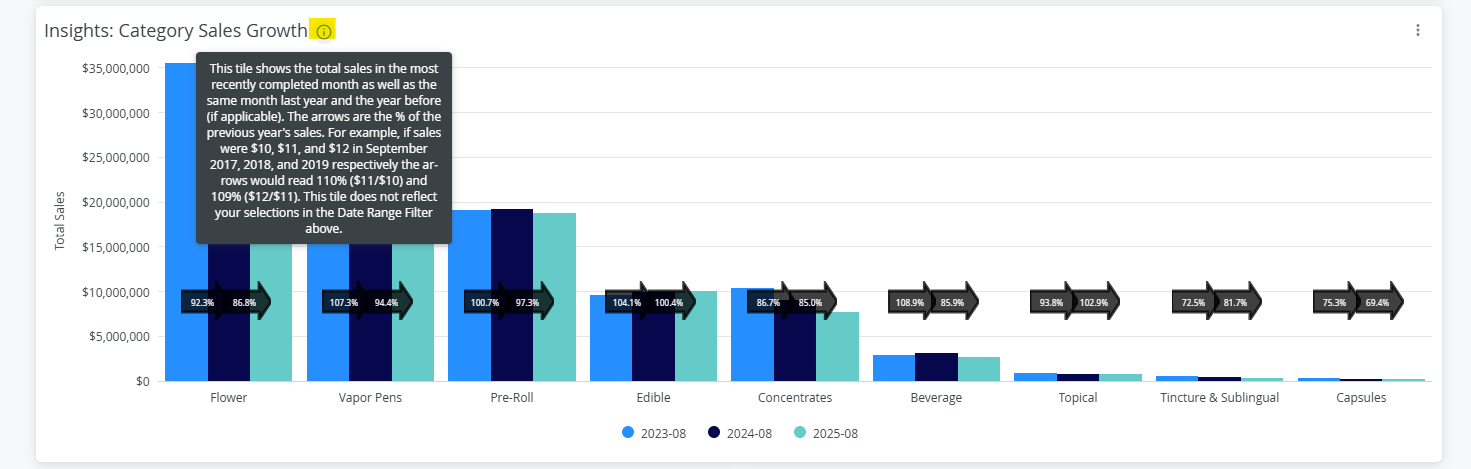
These tiles do not respect the date range filter at the top of the report.
You will see the previous closed month and that same month for the 2 previous years if data is available.
Hover over the information symbol on the Insights: Category Sales Growth tile to learn more about what is displayed in these tiles.
Top Brands
Compare Your Top Brands with the Market
- Your Top Brands: Displays your top-performing brands, based on the stores you’ve selected in the store filter.
- Insights: Top Brands: Shows the top brands from Insights for the comparison market.
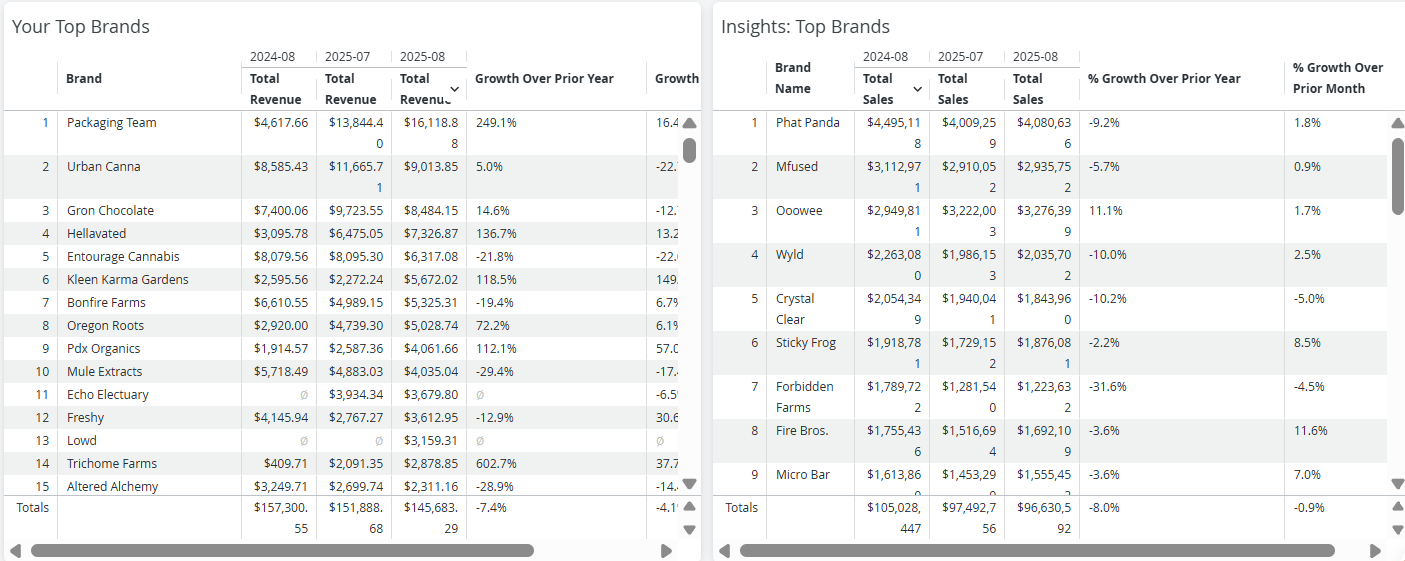
- Scroll horizontally to see growth over the prior year and month.
- Titles highlight performance for the last 2 closed months and last closed month of previous year. The same as the Category Sales Growth tiles above.


