.png)
.png)


Employee Management: Staffing Store
The Staffing Store Report helps you evaluate employee coverage alongside store performance, making it easier to align staffing levels with demand.
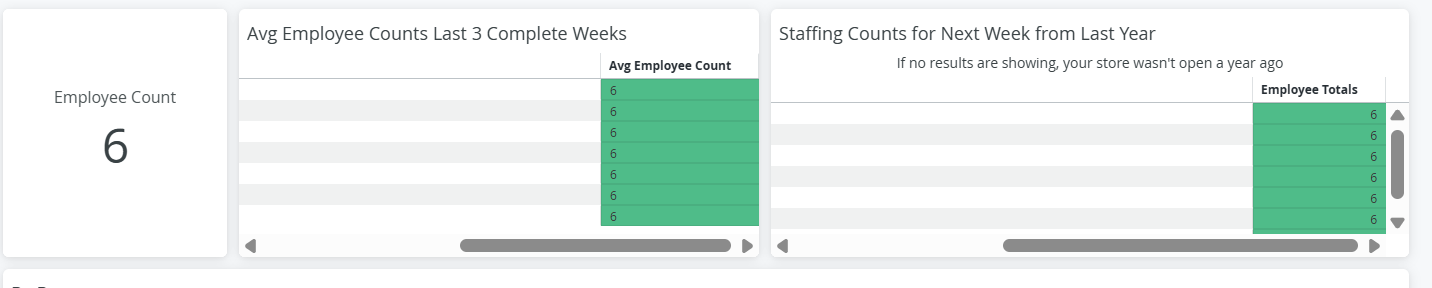
The Average Employee Counts tables provide a quick snapshot of staffing levels:
These tables help you compare current staffing trends against recent performance and historical benchmarks. You’ll need to scroll to the right to see the average employee count.
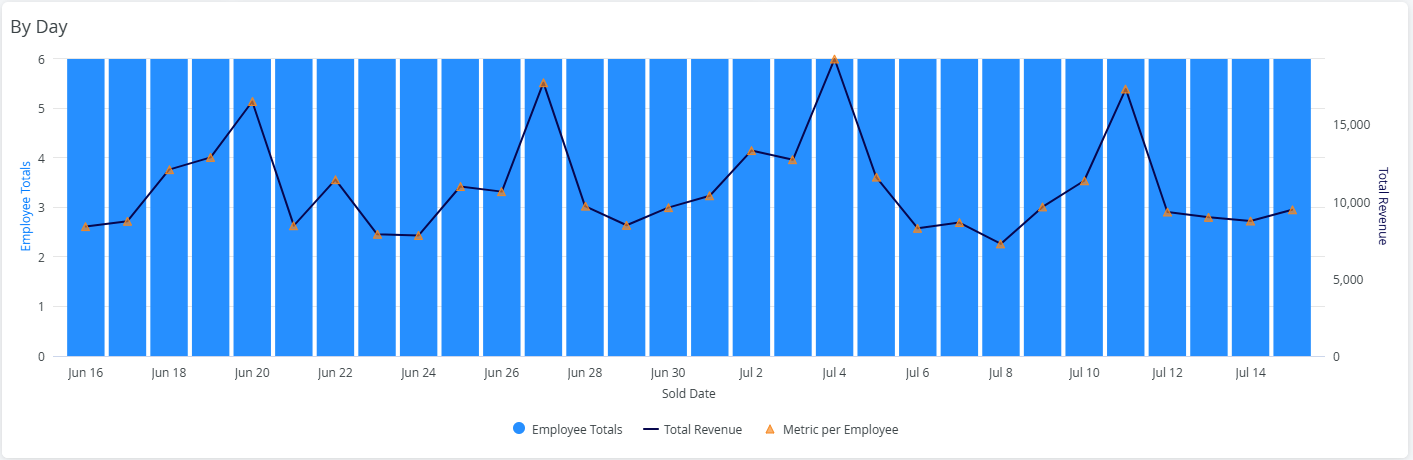
The Employee Totals by Day chart shows how staffing levels fluctuate over time.
Hover over the bars, lines, or triangles to view detailed daily values. This allows you to analyze staffing patterns and identify inconsistencies or trends across days.
Metric per Employee
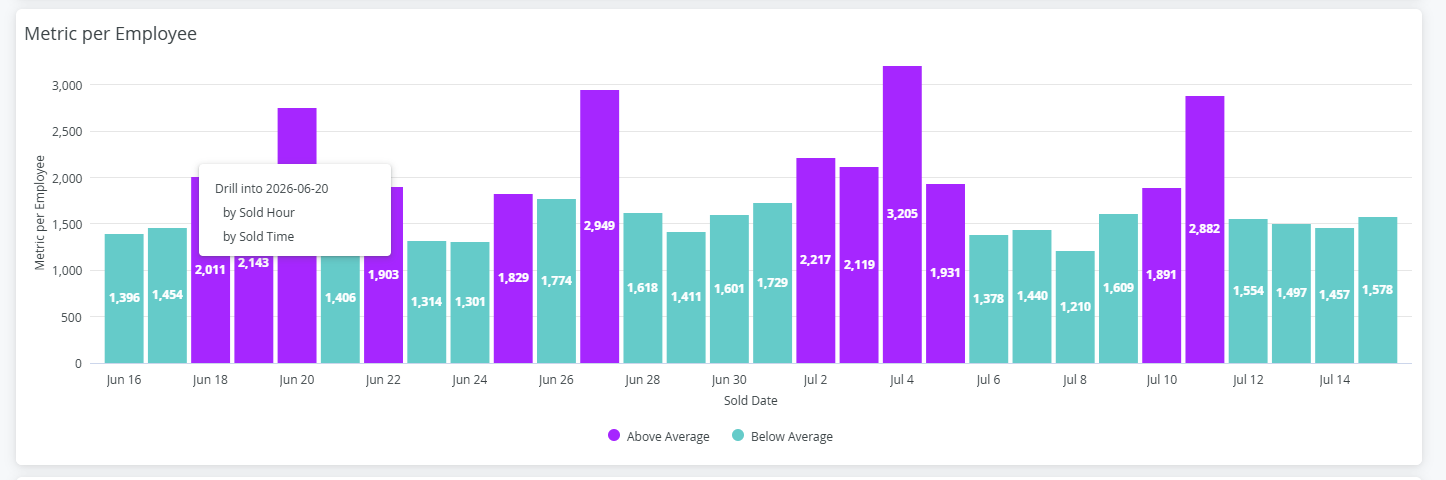
The Metric per Employee section evaluates performance efficiency based on your selected metric.
- Controlled by the Store Metric Selector filter at the top of the page.
- Available metrics include:
- Revenue
- Basket Count
- Gross Margin
Color indicators help highlight performance. Click on any bar in the graph to drill in to sales by hour or exact time of day.
Employee Counts
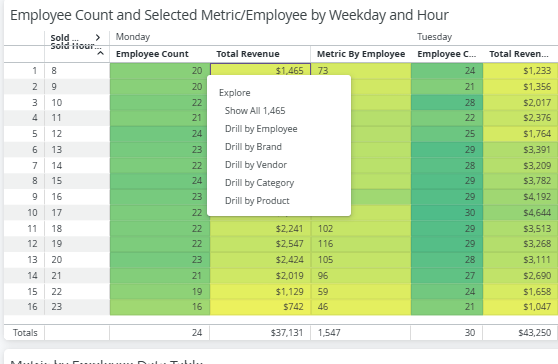
The employee counts tables are looking at sales by hour of day and weekday for the entire date range you have selected in your date range filter.
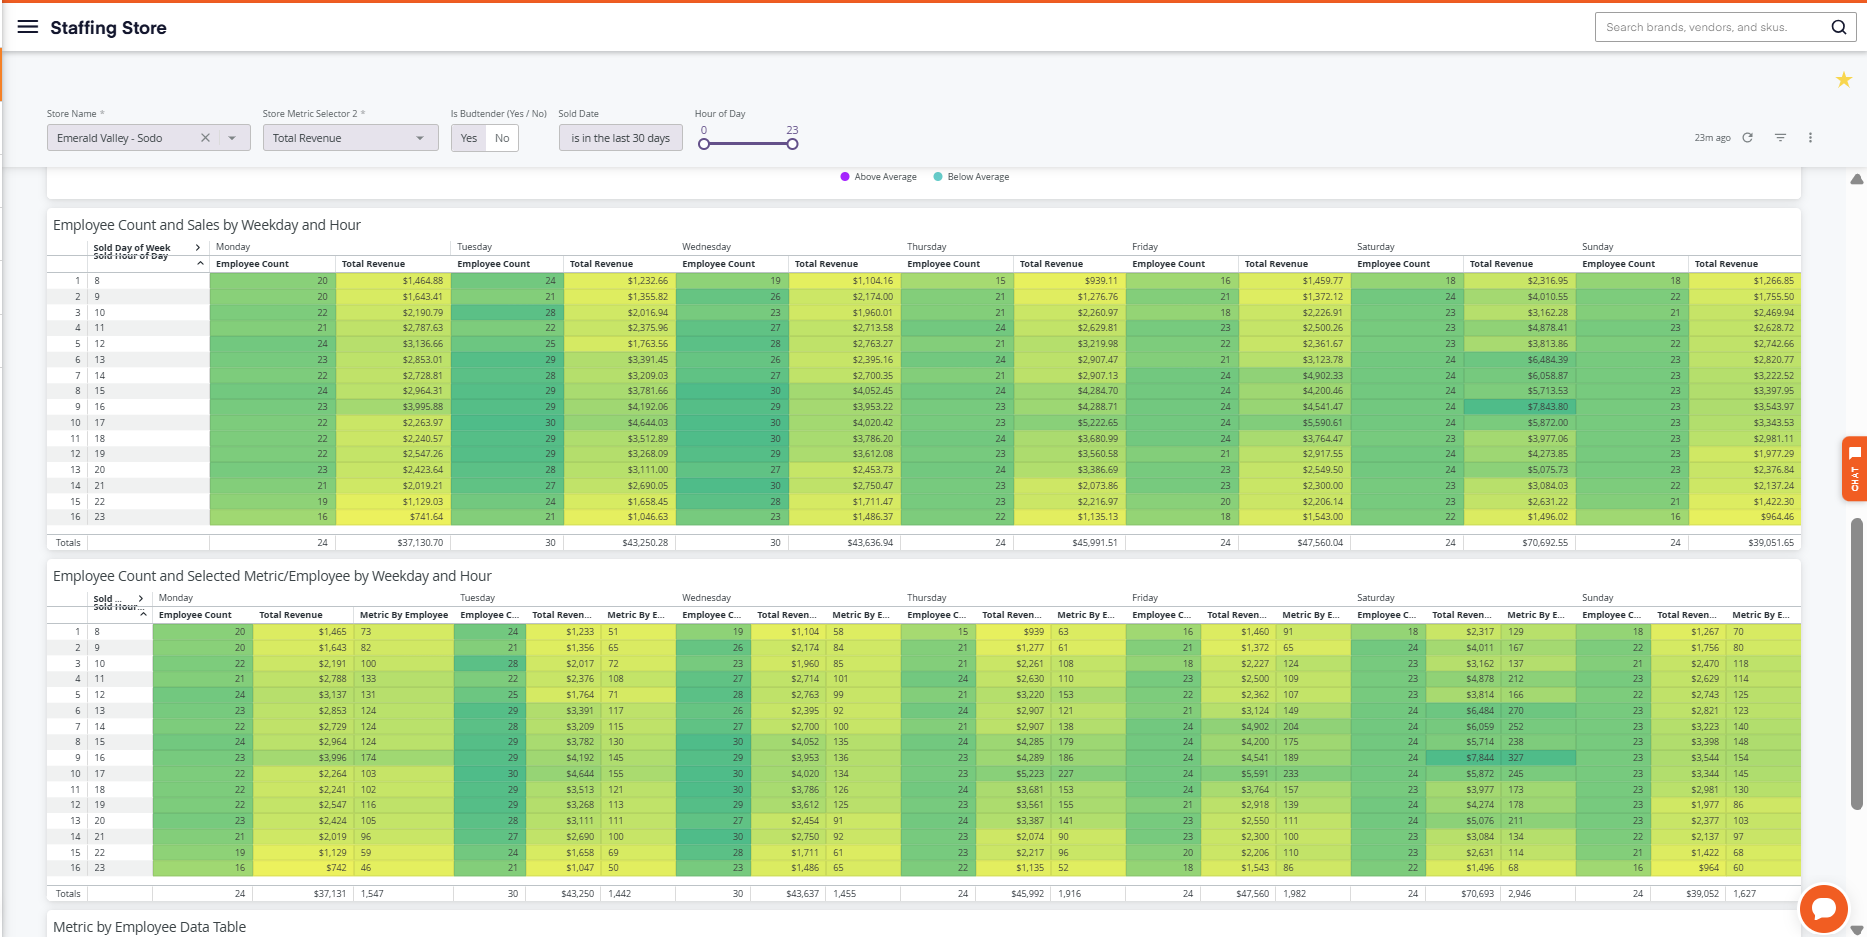
You can click on any revenue amount to drill in to that specific day of the weeks details.
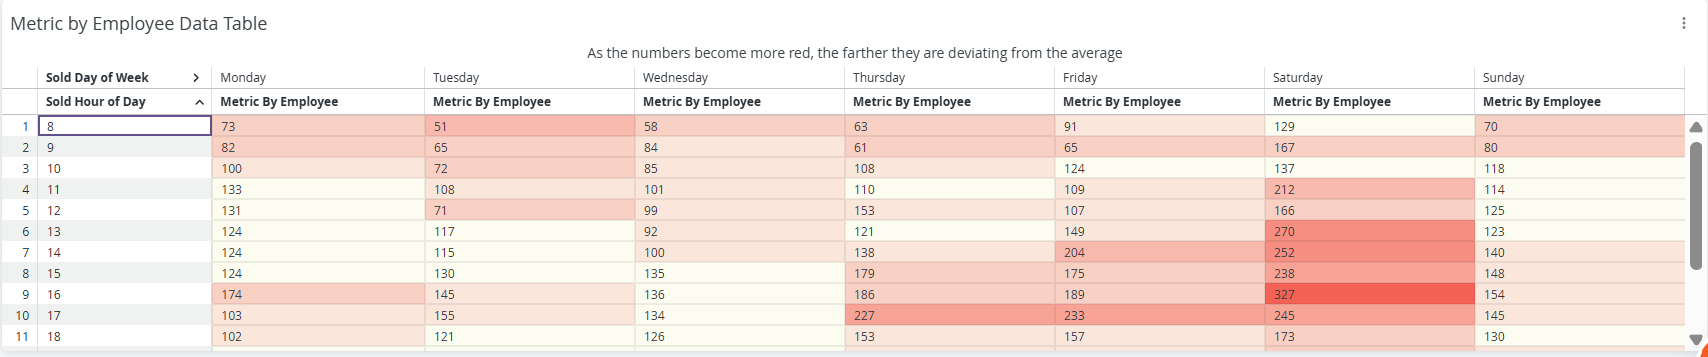
Metric by Employee Data Table
Lastly this table offers the average per employee for the date range you have selected. This is based on your Store Metric Selector filter selection.
By using the Staffing Store Report, you can better align staffing levels with customer demand, improve employee productivity, and optimize overall store performance.


